PRACTICAL LIBERTARIANISM FOR AMERICANS
ADDENDUM TO PART V: THE DESTRUCTION OF INCOME AND WEALTH BY THE STATE
ADDENDUM TO PART V: THE DESTRUCTION OF INCOME AND WEALTH BY THE STATE
The Destruction of Income
I wrote in Part V about the loss of income that has resulted from the intrusions of the regulatory-welfare state into America's economy.
Real (inflation-adjusted) GDP began to rise sharply after the Civil War, thanks mainly to the Second Industrial Revolution. Despite the occasional slump -- which the economy worked its way out of, thank you -- things continued to go well until about 1906. Then the trajectory of GDP growth fell suddenly, sharply, and (it seems) permanently. The Panic of 1907 coincided with, but did not cause, the deceleration of America's economy.
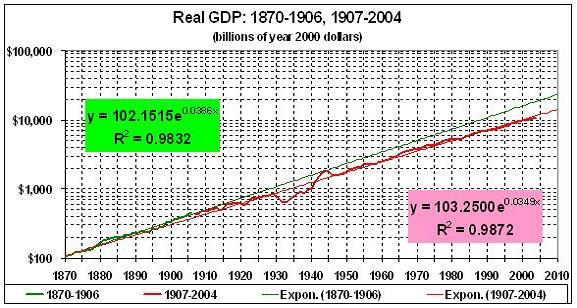
Data on real GDP for 1870-2003 are from Louis Johnston and Samuel H. Williamson, "The Annual Real and Nominal GDP for the United States, 1789 - Present." Economic History Services, March 2004, URL: http://www.eh.net/hmit/gdp/. Real GDP for 2004 estimated by deflating nominal 2004 GDP (source at footnote a) by increase in CPI between 2000 and 2004 (from Bureau of Labor Statistics).
The stock market -- an accurate, if volatile, indicator of the nation's economic health -- corroborates my judgment about the downward shift in economic growth. After 1906 the S&P 500 (as reconstructed back to 1870) dropped to a new trendline that has a shallower slope and an intercept that is 48 percent lower than that of the trendline for 1870-1906.

Real S&P price index constructed from annual closing prices of the S&P 500 Composite Index (series "S&P 500® Composite Price Index (w/GFD extension)"), available at Global Financial Data, Inc., and the GDP deflator (see notes for previous chart).
What happened around 1906? First, the regulatory state began to encroach on American industry with the passage of the Food and Drug Act and the vindictive application of the Sherman Antitrust Act, beginning with Standard Oil (the Microsoft of its day). There followed the ratification of the Sixteenth Amendment (enabling the federal government to tax incomes); the passage of the Clayton Antitrust Act (a more draconian version of the Sherman Act, which also set the stage for unionism); World War I (a high-taxing, big-spending, economic-control operation that whet the appetite of future New Dealers); a respite (the boom of the 1920s, which was owed to the Harding-Coolidge laissez-faire policy toward the economy); and the Great Depression and World War II (truly tragic events that imbued in the nation a false belief in the efficacy of the big-spending, high-taxing, regulating, welfare state).
The stock-market debacle of 1916-20 was as bad as the crash of 1929-33 (see second chart above), and the ensuing recession of 1920-21 was "sharp and deep," as the unemployment rate rose to 12 percent in 1921. But Americans and American politicians didn't panic and scramble to "fix" the economy by adopting one perverse scheme after another. Thus prosperity ensued.
But less than 10 years later -- at the onset of the Great Depression -- Americans and American politicians lost their bearings and joined Germany, Italy, and Russia on the road to serfdom. Most Americans still believe that government intervention brought us out of the Depression. That bit of shopworn conventional wisdom has been debunked thoroughly by Jim Powell, in FDR's Folly: How Roosevelt and His New Deal Prolonged the Great Depression, and Murray N. Rothbard, in America's Great Depression. The bottom line of FDR's Folly is stark:
The Great Depression was a government failure, brought on principally by Federal Reserve policies that abruptly cut the money supply; unit banking laws that made thousands of banks more vulnerable to failure; Hoover's tariff's, which throttled trade; Hoover's taxes, which took unprecedented amounts of money out of people's pockets at the worst possible time; and Hoover's other policies, which made it more difficult for the economy to recover. High unemployment lasted as long as it did because of all the New Deal policies that took more money out of people's pockets, disrupted the money supply, restricted production, harassed employers, destroyed jobs, discouraged investment, and subverted economic liberty needed for sustained business recovery [p. 167].(Also see this.) All we got out of the New Deal was an addiction to government intervention, as people were taught to fear the free market and to believe, perversely, that government intervention led to economic salvation. The inculcation of those attitudes set the stage for the vast regulatory-welfare state that has arisen in the United States since World War II. (See footnote c.)
You know the rest of the story: Spend, tax, redistribute, regulate, elect, spend, tax, redistribute, regulate, elect, ad infinitum. We became locked into the welfare state in the 1970s (see the chart at footnote a), and the regulatory burden on Americans is huge and growing. The payoff:
- Real GDP (in year 2000 dollars) was about $10.7 trillion in 2004.
- If government had grown no more meddlesome after 1906, real GDP might have been $18.7 trillion (see first chart above).
- That is, real GDP per American would have been about $63,000 (in year 2000 dollars) instead of $36,000.
- That's a deadweight loss to the average American of more than 40 percent of the income he or she might have enjoyed, absent the regulatory-welfare state.
- That loss is in addition to the 40-50 percent of current output which government drains from the productive sectors of the economy.
The Destruction of Wealth
The destruction of income necessarily results in the destruction of wealth; income not received cannot be saved and invested.
How much wealth has been forgone because of the vast amounts of income that have been destroyed in the past 100 years? I can't hazard a guess. But by drawing on the data presented in the charts above I can estimate how much higher stock prices would be today if government were no more intrusive than it had been a century ago. Consider this chart of the relationship between GDP and the S&P index (data for 1870-1906 are plotted in green, data for 1907-2004 are plotted in red):

As I noted above, GDP in 2004 might have been $18.7 trillion if government had grown no more intrusive after the early 1900s. Taking that level of GDP and using the relationship between GDP and the S&P for 1870-1906 (shown in green), the S&P price index for 2004 would have been 30.8 (with 1870 = 1). The actual S&P price index for 2004 stood at 20.4.* In other words, the stocks of corporations in the S&P 500 are currently undervalued by one-third because of the depradations of the regulatory-welfare state, which have lowered investors' expectations for future earnings.** The effect of those lowered expectations is shown in the difference between the green (1870-1906) and red (1907-2004) trendlines.
And that's only the portion of wealth that's represented in the S&P 500. Think of all the other forms in which wealth is stored: stocks not included in the S&P 500, corporate bonds, mortgages, home equity, and so on.
If government had left its grubby hands off the economy, there never would have been a Great Depression, Social Security, Medicare, Medicaid, and the myriad regulations that have us tied in knots.
__________
* The index for 2004 is significantly out of line with the trendline for 1907-2004, which suggests that there is still some air in the stock market bubble. Or it could be that the market is anticipating the expected growth surge I wrote about toward the end of Part V -- a surge that may not take place if environmental hysteria prevails and Social Security taxes are raised.
** As Jeremy Siegel, author of Stocks for the Long Run, explains in a piece at the Library of Economics and Liberty:
The price of a share of stock, like that of any other financial asset, equals the present value of the expected stream of future cash payments to the owner. The cash payments available to a shareholder are uncertain and subject to the earnings of the firm....
[T]he price of a stock can rise even if the firm does not pay a dividend and never intends to do so. If and when the assets of these firms are sold or liquidated, a cash distribution will be made and shareholders will realize a capital gain. Some firms pursue this policy to enable their shareholders to realize lower taxes, since taxes on capital gains are deferred and often paid at a lower rate.